Arcs Assessment Plots
|
|
|
| Data: August 5, 2008 |
| Submitter: Anonymous |
| Chip Type: Affymetrix Mouse 430 2.0 |
| Fitting Function: RMAExpress Release 1.0 |
| Comments From the Submitter: We were unable to identify the cause of the arc clearly displayed on multiple arrays. All arrays were processed at the same facility on two different machines and on variety of dates. There is no correlation between the machine or process date and the arc. The arc is visible on the original DAT files and does not appear to be an artifact of normalization. |
| Other plots : Residuals pseudo-chip images |
NUSE
 |
RLE
 |
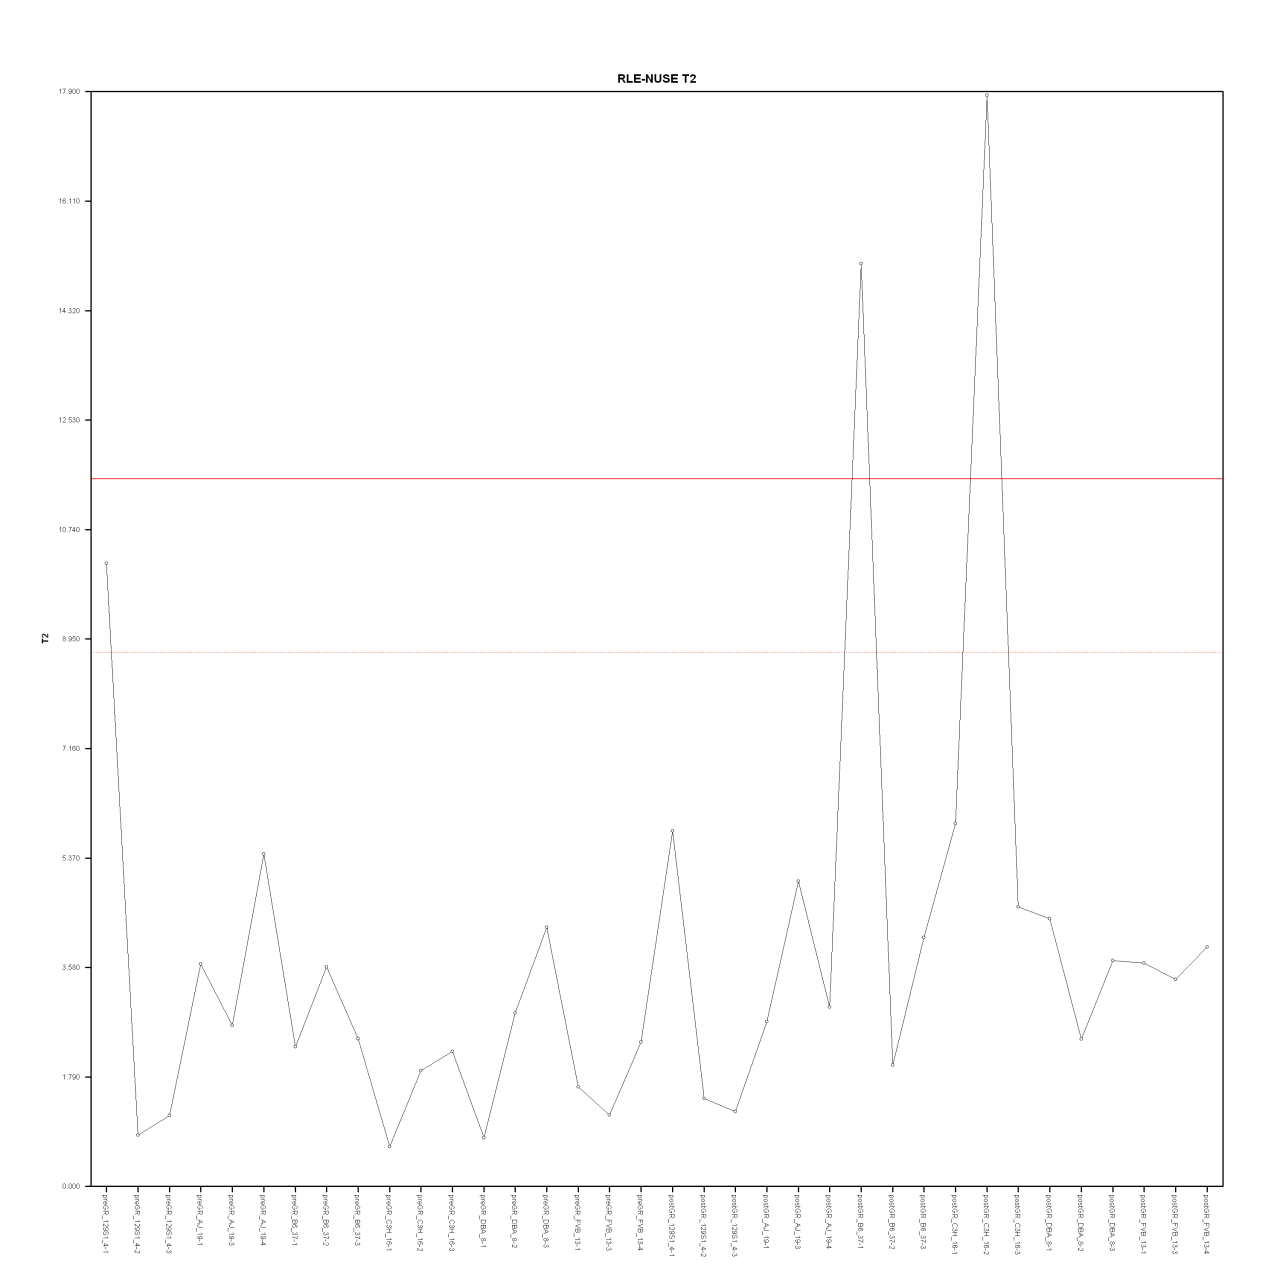
RLE-NUSE T2
 |
RLE-NUSE Multi-plot
 |
| Return to index |
|
Note that if you use the images for personal use on this page you should cite this website. In cases where the contributor is named please get permission directly from the contributor. Permission is not given for formal publications.
|


